
#Short Answer
Artificial intelligence (AI) and dashboards for real-time monitoring represent a convergence of advanced analytics, machine learning, and interacti...
#Infobox
Artificial intelligence (AI) and dashboards for real-time monitoring enhance operational efficiency by providing instantaneous data visualization and predictive analytics.
#Overview
Artificial intelligence (AI) and dashboards for real-time monitoring represent a convergence of advanced analytics, machine learning, and interactive data visualization tools designed to provide immediate insights into operational, financial, or system performance. These systems leverage AI-driven algorithms to process vast streams of data in milliseconds, enabling organizations to detect anomalies, predict trends, and respond to events as they occur. Dashboards serve as the user interface, presenting complex datasets in intuitive formats such as charts, graphs, heatmaps, and KPI indicators.
Real-time monitoring powered by AI extends beyond traditional static reporting by incorporating predictive and prescriptive analytics. This allows businesses to not only observe current conditions but also anticipate future states, such as equipment failure, market shifts, or security breaches. The integration of AI enhances the accuracy and relevance of dashboard outputs, reducing reliance on manual interpretation and enabling faster, data-driven decision-making across industries including healthcare, finance, manufacturing, logistics, and energy.
#History / Background
The concept of real-time monitoring dates back to early industrial control systems in the 1960s and 1970s, where sensors and SCADA (Supervisory Control and Data Acquisition) systems were used to monitor physical processes. However, the integration of AI into these systems began in the 1980s with the advent of expert systems and rule-based automation. The 1990s saw the rise of business intelligence (BI) tools like Business Objects and Cognos, which introduced digital dashboards for static data reporting.
The breakthrough came in the early 2010s with the proliferation of big data technologies and cloud computing. Companies like Google, Amazon, and Microsoft launched AI services such as Google Cloud AI, Amazon SageMaker, and Azure Machine Learning, enabling scalable real-time data processing. Concurrently, visualization platforms like Tableau and Power BI evolved to support live data connections and AI-enhanced analytics.
By the mid-2010s, the Internet of Things (IoT) revolutionized real-time monitoring by embedding sensors in devices across industries. AI models trained on historical and streaming data began enabling predictive maintenance in manufacturing, fraud detection in finance, and patient monitoring in healthcare. Today, real-time AI dashboards are a cornerstone of digital transformation strategies, embedded in platforms such as SAP Analytics Cloud, IBM Watson, and Looker.
#How It Works
#Data Ingestion
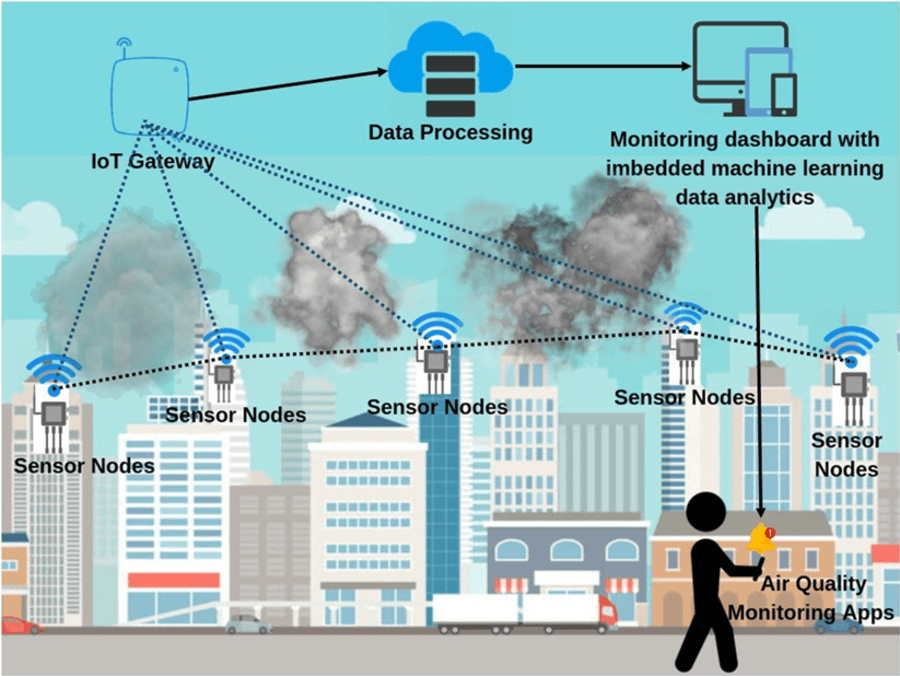
Real-time AI monitoring systems begin with data ingestion from multiple sources, including IoT devices, transaction logs, social media feeds, ERP systems, and third-party APIs. Data streams are captured using protocols such as MQTT, Apache Kafka, or RESTful APIs. Streaming platforms like Apache Flink or Spark Streaming process data in motion, filtering, aggregating, and enriching it before analysis.
#AI Processing
Once ingested, data is fed into AI models that perform several functions:
- Anomaly Detection: Machine learning models, particularly those using Isolation Forest, Autoencoders, or LSTM networks, identify deviations from normal patterns in real time.
- Predictive Analytics: Time-series models like ARIMA, Prophet, or deep learning-based Transformers forecast future trends based on historical and current data.
- Natural Language Processing (NLP): Sentiment analysis and text classification extract insights from unstructured data such as customer reviews or support tickets.
- Computer Vision: In industrial or surveillance contexts, AI models analyze video feeds to detect objects, defects, or unauthorized access.
#Dashboard Visualization
The processed insights are then rendered on interactive dashboards using visualization libraries such as D3.js, Chart.js, or proprietary tools like Tableau and Power BI. Dashboards are customizable, allowing users to configure layouts, set thresholds, and receive alerts. Features often include:
- Live KPIs (e.g., server uptime, sales velocity, energy consumption)
- Interactive filters and drill-down capabilities
- Automated alerts via email, SMS, or push notifications
- Integration with collaboration tools like Slack or Microsoft Teams
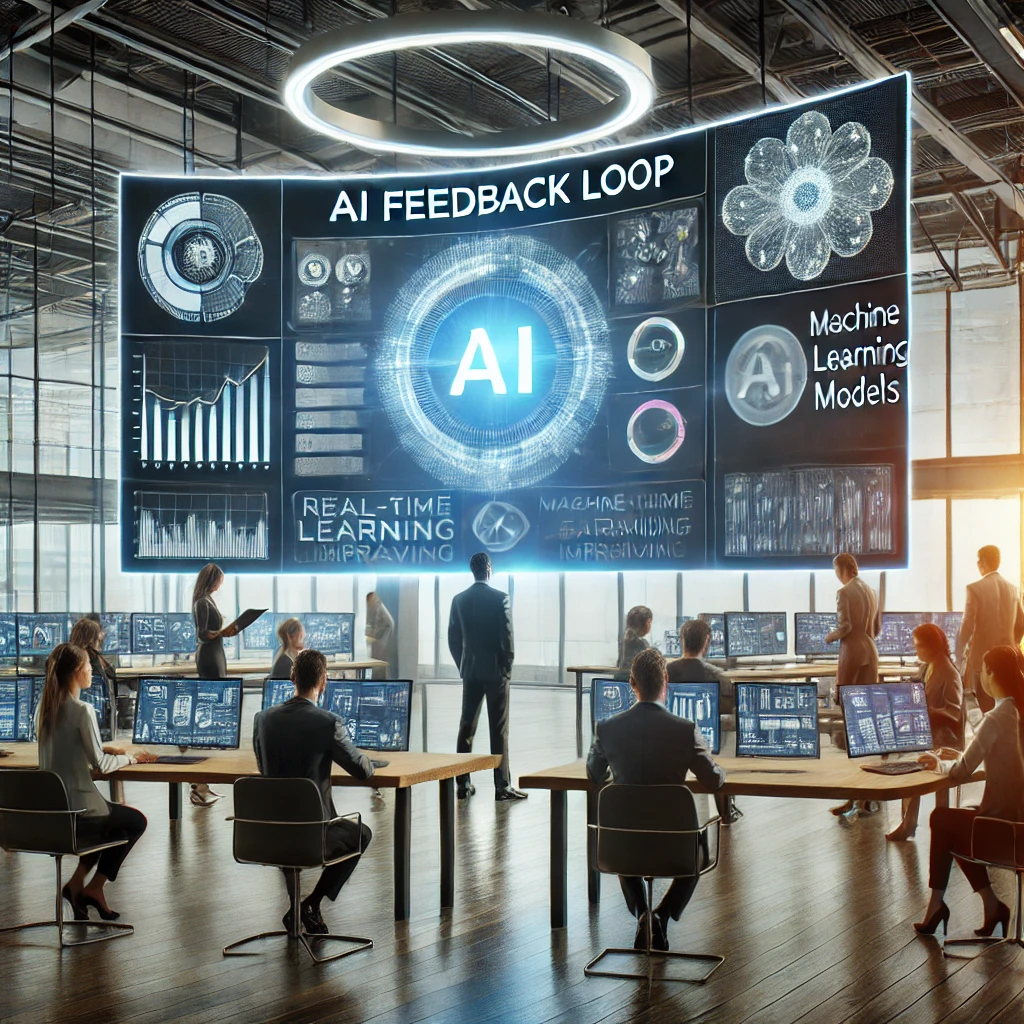
#Feedback and Continuous Learning
AI models are continuously updated through feedback loops. User interactions, such as acknowledging alerts or adjusting thresholds, are logged and used to retrain models. This ensures that dashboards remain accurate and relevant as conditions evolve. Edge computing further enhances responsiveness by processing data locally on devices, reducing latency in time-sensitive applications.
#Important Facts
- Latency: Modern AI-powered dashboards can process and display data within 100 milliseconds to 2 seconds, depending on system architecture.
- Scalability: Cloud-based platforms can handle millions of data points per second, supporting global enterprises.
- Accuracy: AI models trained on large datasets can achieve over 95% accuracy in anomaly detection and prediction tasks.
- Cost Reduction: Predictive maintenance using AI dashboards can reduce maintenance costs by up to 30% and downtime by 50%.
- Regulatory Compliance: Dashboards help organizations comply with standards such as GDPR, HIPAA, and ISO 27001 by providing audit trails and real-time reporting.
- Energy Efficiency: In smart grids, AI monitoring reduces energy waste by up to 15% through optimized distribution.
#Related Terms
#FAQ
What does AI And Dashboards: Real-Time Monitoring cover?
Explores how artificial intelligence shapes dashboards and real-time monitoring, covering practical use cases, benefits, limitations, and risks.
Why is AI And Dashboards: Real-Time Monitoring important?
It helps readers understand key concepts, compare practical use cases, and evaluate how Artificial Intelligence decisions affect outcomes, risks, and implementation choices.
What should readers verify before applying this topic?
Readers should compare the benefits, limitations, data requirements, and related themes such as Dashboard, Realtime, Monitoring before using the ideas in real projects.
#References
- AI And Dashboards: Real-Time Monitoring terminology and background research
- AI And Dashboards: Real-Time Monitoring use cases, implementation examples, and limitations
- Artificial Intelligence best practices, standards, and risk guidance
- Dashboard case studies, benchmarks, and current industry analysis
Comments
No comments yet. Start the discussion with a useful note.