

#Short Answer
Explains What Is Principal Component Analysis (pca), including the core definition, how it works, practical examples, and limitations.
#Infobox
#Overview
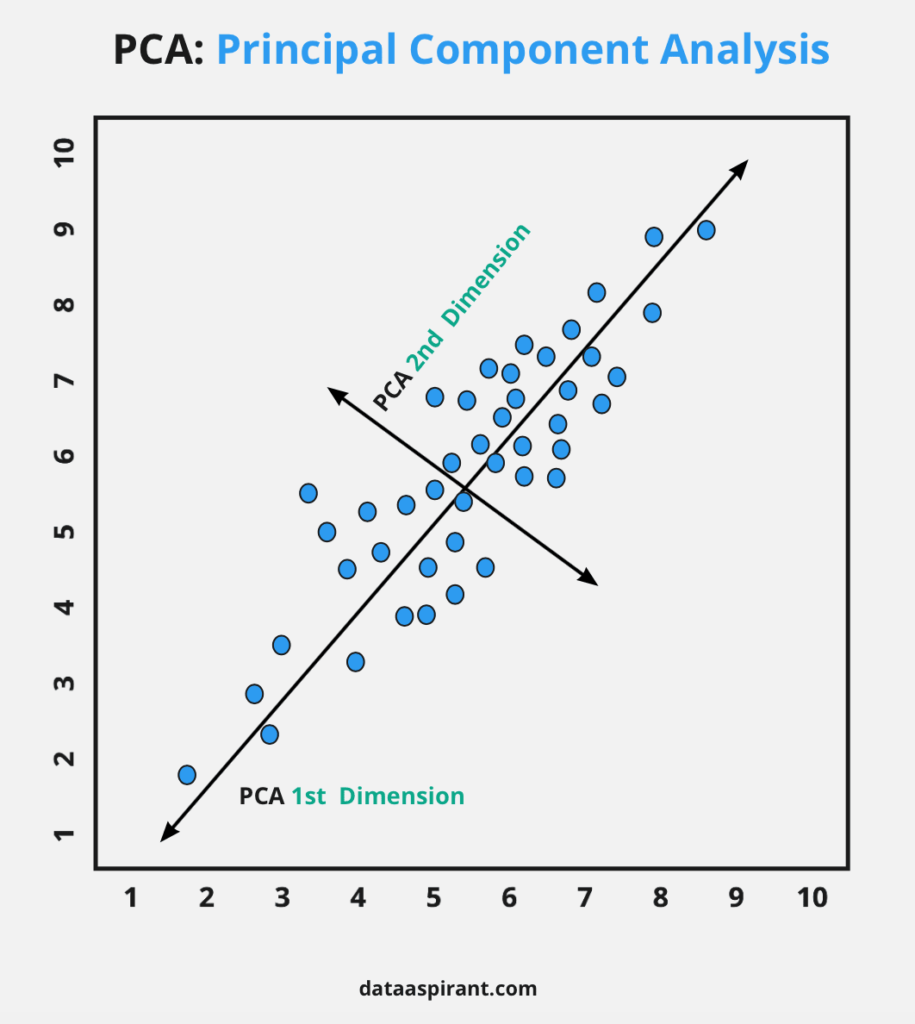
Principal Component Analysis (PCA) is a linear, unsupervised machine learning algorithm that identifies patterns in data by reducing its dimensionality. It projects high-dimensional data onto a lower-dimensional space while retaining the maximum variance possible. PCA is widely used in fields such as bioinformatics, finance, image processing, and natural language processing to simplify complex datasets, remove noise, and improve computational efficiency. The core idea behind PCA is to transform the original variables into a new set of orthogonal (uncorrelated) variables called principal components. The first principal component captures the largest variance in the data, the second captures the next largest variance orthogonal to the first, and so on. This sequential prioritization allows PCA to retain the most significant features while discarding redundant information.
#History / Background
The foundations of PCA were laid in the early 20th century by the British mathematician and statistician Karl Pearson in 1901. Pearson introduced the concept in his paper "On Lines and Planes of Closest Fit to Systems of Points in Space", where he described a method to find the best-fitting line or plane for a set of data points in a multidimensional space. This work was motivated by problems in biology and astronomy, where high-dimensional data was common. Later, Harold Hotelling expanded on Pearson’s ideas in 1933 by formalizing the method for multivariate data analysis. Hotelling’s work in "Analysis of a Complex of Statistical Variables into Principal Components" established PCA as a fundamental tool in multivariate statistics. The development of computers in the mid-20th century further popularized PCA, as it became feasible to perform the necessary matrix computations on large datasets. In the 1960s and 1970s, PCA found applications in psychology, economics, and social sciences, where researchers sought to analyze complex datasets with many interrelated variables. The advent of modern computing and machine learning in the late 20th and early 21st centuries propelled PCA into broader use, particularly in fields like genomics, computer vision, and artificial intelligence.
#How It Works
PCA operates through a series of mathematical steps that transform the original dataset into a new coordinate system. The process can be broken down as follows:
#Step 1: Standardization Before applying PCA, the data is typically standardized (mean-centered and scaled to unit variance). This ensures that each variable contributes equally to the analysis, preventing variables with larger scales from dominating the principal components.
#Step 2: Covariance Matrix Computation The covariance matrix of the standardized data is computed. The covariance matrix captures the relationships between all pairs of variables, indicating how much they vary together.
#Step 3: Eigen Decomposition The covariance matrix is decomposed into its eigenvalues and eigenvectors. Eigenvectors represent the directions of maximum variance in the data, while eigenvalues indicate the magnitude of variance along those directions. The eigenvectors are sorted in descending order of their corresponding eigenvalues, as the first principal component corresponds to the direction of highest variance.
#Step 4: Principal Component Selection A subset of the top k eigenvectors (principal components) is selected based on the desired dimensionality reduction. The choice of k can be guided by the explained variance ratio, which measures the proportion of the dataset’s total variance captured by each principal component.
#Step 5: Projection The original data is projected onto the new subspace defined by the selected principal components. This transformed dataset retains the most significant patterns while reducing noise and redundancy.
#Mathematical Formulation Given a dataset X with n observations and d variables, PCA seeks to find a linear transformation W such that: \[ \mathbfY = \mathbfX \mathbfW \] where Y is the transformed dataset in the lower-dimensional space, and W is a matrix whose columns are the principal components. The transformation maximizes the variance of Y under the constraint that the components are orthogonal.
#Important Facts
- Dimensionality Reduction: PCA reduces the number of features in a dataset while retaining most of the variance, making it easier to visualize and analyze.
- Orthogonality: Principal components are orthogonal to each other, meaning they are uncorrelated. This property simplifies interpretation and avoids redundancy.
- Variance Maximization: The first principal component captures the direction of maximum variance, and each subsequent component captures the next highest variance orthogonal to the previous ones.
- Noise Reduction: By discarding components with low variance (often representing noise), PCA can improve the signal-to-noise ratio in the data.
- Computational Efficiency: PCA is computationally efficient for large datasets, especially when using algorithms like the power iteration or singular value decomposition (SVD).
- Interpretability: While PCA simplifies data, the principal components may not always have a clear physical or semantic meaning, as they are linear combinations of the original variables.
- Assumptions: PCA assumes that the data is linear and that the principal components are orthogonal. Non-linear variants like Kernel PCA address these limitations.
#Timeline
- Foundational ideas
Core concepts and early methods shape What Is Principal Component Analysis (pca)?.
- Practical use
Tools, examples, and real-world deployments make the topic easier to evaluate.
- Responsible implementation
Current work focuses on reliability, governance, performance, and measurable impact.
#Related Terms
#FAQ
What does What Is Principal Component Analysis (pca)? cover?
Explains What Is Principal Component Analysis (pca), including the core definition, how it works, practical examples, and limitations.
Why is What Is Principal Component Analysis (pca)? important?
It helps readers understand key concepts, compare practical use cases, and evaluate how Artificial Intelligence decisions affect outcomes, risks, and implementation choices.
What should readers verify before applying this topic?
Readers should compare benefits, limitations, data requirements, and related themes such as Principal, Component, Analysis before using the ideas in real projects.
#References
- What Is Principal Component Analysis (pca)? terminology and background research
- What Is Principal Component Analysis (pca)? use cases, implementation examples, and limitations
- Artificial Intelligence best practices, standards, and risk guidance
- Principal case studies, benchmarks, and current industry analysis




Comments
No comments yet. Start the discussion with a useful note.